Datadog Wants $50K/Year. Your Raspberry Pi Doesn’t Care.
You’ve seen the Datadog pricing page. You’ve had the moment where you squint at the per-host fee, do some mental math, and quietly close the tab. For a home lab or a small self-hosted stack, paying enterprise APM prices is like hiring a private chef to make instant ramen. Technically achievable. Deeply unnecessary.
The open-source observability ecosystem has caught up. OpenTelemetry (OTel) is now the vendor-neutral standard for traces, metrics, and logs, and the tools around it (the Grafana LGTM stack, SigNoz, Coroot) give you the full picture without a monthly invoice that would make your CFO cry.
We’ll build the OTel mental model, get a Collector running via Docker Compose, route signals to Grafana Tempo, Loki, and Mimir, and instrument a Python app with zero code changes. By the end you’ll have distributed tracing, log correlation, and dashboards, for the cost of electricity and mild configuration frustration.
The Mental Model: Signals, SDKs, and the Collector
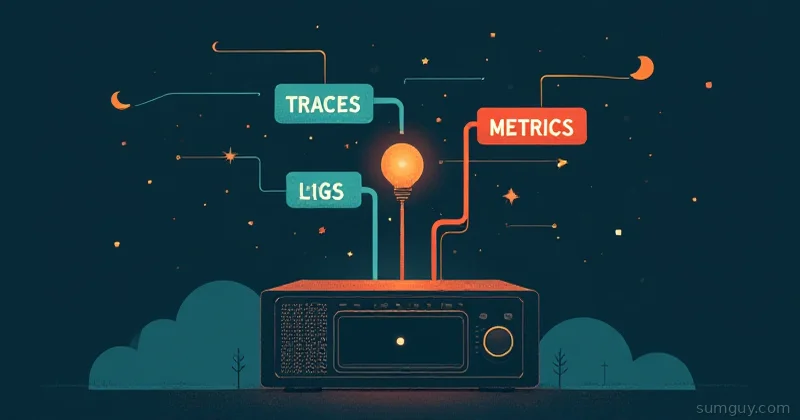
OpenTelemetry gives you three signal types:
- Traces: a request’s journey across services. Spans are the individual steps. Tempo stores these.
- Metrics: counters, gauges, histograms. Request rates, latency percentiles, memory usage. Mimir (or plain Prometheus) stores these.
- Logs: structured or unstructured text events. Loki stores these.
The OTel architecture has two moving parts:
SDK / Auto-instrumentation: the code-side piece. For Python, Node, Java, Go, etc., OTel provides language SDKs that produce telemetry data. The auto-instrumentation agents go further: they patch common libraries (Flask, Django, FastAPI, Express, HTTP clients, database drivers) automatically, you don’t modify your application code at all. You just run it with a wrapper.
OTel Collector: a standalone process that receives telemetry from your apps over OTLP (the OTel wire protocol), processes it (batching, filtering, enrichment), and exports to your backends. Think of it as a router that decouples your apps from your storage backends. Swap Tempo for Jaeger tomorrow? Change one line in the Collector config, not every app.
The Collector pipeline is: receivers → processors → exporters. Simple, powerful, occasionally maddening to debug the first time.
The Stack We’re Building
App (auto-instrumented) │ │ OTLP/gRPC :4317 ▼OTel Collector ├── traces → Grafana Tempo :3200 ├── metrics → Grafana Mimir :9009 └── logs → Grafana Loki :3100 │ ▼ Grafana UI :3000Everything runs on a single Docker Compose stack. For a home lab this is plenty. For something larger, Collector and backends split into separate machines, same config, different targets.
The Collector Config
This is the most important file. Get this right and the rest is plumbing.
receivers:  otlp:    protocols:      grpc:        endpoint: 0.0.0.0:4317      http:        endpoint: 0.0.0.0:4318
processors:  batch:    timeout: 5s    send_batch_size: 1024  memory_limiter:    check_interval: 1s    limit_mib: 512  resource:    attributes:      - key: deployment.environment        value: homelab        action: upsert
exporters:  otlp/tempo:    endpoint: tempo:4317    tls:      insecure: true
  otlphttp/loki:    endpoint: http://loki:3100/otlp    tls:      insecure: true
  prometheusremotewrite:    endpoint: http://mimir:9009/api/v1/push    tls:      insecure: true
  debug:    verbosity: basic
service:  pipelines:    traces:      receivers: [otlp]      processors: [memory_limiter, batch]      exporters: [otlp/tempo, debug]
    metrics:      receivers: [otlp]      processors: [memory_limiter, batch, resource]      exporters: [prometheusremotewrite, debug]
    logs:      receivers: [otlp]      processors: [memory_limiter, batch]      exporters: [otlphttp/loki, debug]
A few things worth calling out:
The debug exporter in every pipeline is your best friend when things don’t show up where you expect. verbosity: basic prints a one-liner per batch. Bump it to detailed when you’re troubleshooting a specific signal. Remove it (or set verbosity: normal) once everything’s working.
The memory_limiter processor goes first, always. If your Collector OOMs under a spike, you want it to start dropping data before the process dies. Dropping some traces is fine. A crashed Collector drops everything.
resource processor stamps every metric with deployment.environment=homelab. This is optional but useful when you eventually have staging and prod pointing at the same backends.
Docker Compose: The Full Stack
networks:  observability:    driver: bridge
volumes:  tempo-data:  loki-data:  mimir-data:  grafana-data:
services:  otel-collector:    image: otel/opentelemetry-collector-contrib:0.130.0    command: ["--config=/etc/otelcol/config.yaml"]    volumes:      - ./otel-collector-config.yaml:/etc/otelcol/config.yaml:ro    ports:      - "4317:4317"   # OTLP gRPC      - "4318:4318"   # OTLP HTTP    networks:      - observability    restart: unless-stopped
  tempo:    image: grafana/tempo:2.7.1    command: ["-config.file=/etc/tempo.yaml"]    volumes:      - ./tempo-config.yaml:/etc/tempo.yaml:ro      - tempo-data:/var/tempo    ports:      - "3200:3200"    networks:      - observability    restart: unless-stopped
  loki:    image: grafana/loki:3.4.1    command: ["-config.file=/etc/loki/local-config.yaml"]    volumes:      - loki-data:/loki    ports:      - "3100:3100"    networks:      - observability    restart: unless-stopped
  mimir:    image: grafana/mimir:2.15.0    command: ["--config.file=/etc/mimir.yaml"]    volumes:      - ./mimir-config.yaml:/etc/mimir.yaml:ro      - mimir-data:/data    ports:      - "9009:9009"    networks:      - observability    restart: unless-stopped
  grafana:    image: grafana/grafana:11.5.1    environment:      - GF_AUTH_ANONYMOUS_ENABLED=true      - GF_AUTH_ANONYMOUS_ORG_ROLE=Admin      - GF_AUTH_DISABLE_LOGIN_FORM=true    volumes:      - grafana-data:/var/lib/grafana      - ./grafana-datasources.yaml:/etc/grafana/provisioning/datasources/datasources.yaml:ro    ports:      - "3000:3000"    networks:      - observability    depends_on:      - tempo      - loki      - mimir    restart: unless-stopped
You’ll notice anonymous auth is enabled on Grafana. For a home lab behind a firewall or Tailscale, that’s fine. For anything facing the internet, drop GF_AUTH_ANONYMOUS_ENABLED and set up proper credentials.
A note on logs: the old standalone loki exporter was deprecated and removed from the Collector. Loki v3 ingests OTLP natively, so you just point the standard otlphttp exporter at Loki’s /otlp endpoint (shown above). One less special-snowflake component to babysit.
The otel/opentelemetry-collector-contrib image is still the one to grab: the -contrib variant bundles the prometheusremotewrite exporter plus a pile of other community components. The base otel/opentelemetry-collector image is leaner but missing a lot of them. Use contrib.
For Tempo, Loki, and Mimir minimal configs (the *-config.yaml files), their respective GitHub repos have local-config.yaml examples that use filesystem storage. Copy those and you’re running. The Compose file above assumes you’ve dropped those in the same directory.
Grafana datasources provisioning file wires everything together automatically:
apiVersion: 1
datasources:  - name: Tempo    type: tempo    url: http://tempo:3200    isDefault: false    jsonData:      tracesToLogsV2:        datasourceUid: loki        spanStartTimeShift: "-1m"        spanEndTimeShift: "1m"        filterByTraceID: true        filterBySpanID: false
  - name: Loki    type: loki    uid: loki    url: http://loki:3100    isDefault: false
  - name: Mimir    type: prometheus    url: http://mimir:9009/prometheus    isDefault: true
The tracesToLogsV2 block in Tempo’s config is the good stuff. It tells Grafana: when you’re looking at a trace in Tempo, here’s how to jump to correlated logs in Loki. Set filterByTraceID: true and your trace IDs need to be in your log lines, which the OTel SDK handles automatically when you set it up correctly.
Instrumenting a Python App (Zero Code Changes)
Here’s a minimal Flask app. It does nothing interesting, but after instrumentation, you’ll see every HTTP request as a trace, with timing breakdowns and status codes.
from flask import Flask, jsonifyimport timeimport random
app = Flask(__name__)
@app.route("/")def index():    return jsonify({"status": "ok", "service": "demo-api"})
@app.route("/slow")def slow():    time.sleep(random.uniform(0.1, 0.8))    return jsonify({"result": "eventually"})
@app.route("/fail")def fail():    if random.random() > 0.5:        return jsonify({"error": "coin flip lost"}), 500    return jsonify({"result": "lucky"})
if __name__ == "__main__":    app.run(host="0.0.0.0", port=8080)
No OTel imports. No manual span creation. Now instrument it:
# Install the auto-instrumentation packagespip install opentelemetry-distro opentelemetry-exporter-otlpopentelemetry-bootstrap -a install
# Run with auto-instrumentation, pointing at the CollectorOTEL_SERVICE_NAME=demo-api \OTEL_EXPORTER_OTLP_ENDPOINT=http://localhost:4317 \OTEL_EXPORTER_OTLP_PROTOCOL=grpc \OTEL_TRACES_EXPORTER=otlp \OTEL_METRICS_EXPORTER=otlp \OTEL_LOGS_EXPORTER=otlp \OTEL_PYTHON_LOG_CORRELATION=true \opentelemetry-instrument python app.py
opentelemetry-bootstrap -a install detects installed packages and installs the matching OTel instrumentation libraries automatically. Flask gets opentelemetry-instrumentation-flask, requests gets opentelemetry-instrumentation-requests, and so on.
OTEL_PYTHON_LOG_CORRELATION=true injects trace_id and span_id into your log records. That’s what enables the Tempo→Loki drill-down in Grafana.
Hit the /slow and /fail endpoints a few times:
for i in $(seq 1 20); do curl -s http://localhost:8080/slow > /dev/null curl -s http://localhost:8080/fail > /dev/nulldoneOpen Grafana at http://localhost:3000, go to Explore → Tempo, and you’ll see your traces. Click one, see the spans. Notice the p95 latency on /slow being terrible. Click the logs icon to jump to correlated log lines in Loki. That’s distributed tracing working in your home lab.
What About Node.js?
Same idea, different wrapper. For a Node/Express app:
npm install @opentelemetry/sdk-node \  @opentelemetry/auto-instrumentations-node \  @opentelemetry/exporter-trace-otlp-grpc \  @opentelemetry/exporter-metrics-otlp-grpc
# Run with the SDK auto-initializationOTEL_SERVICE_NAME=demo-node \OTEL_EXPORTER_OTLP_ENDPOINT=http://localhost:4317 \node --require @opentelemetry/auto-instrumentations-node/register app.js
The --require flag loads the auto-instrumentation before your application code starts. HTTP, Express, pg, redis, gRPC: all get patched automatically.
Semantic Conventions: Don’t Reinvent Attribute Names
OTel defines standard attribute names (semantic conventions) for common concepts. http.method, http.status_code, db.system, service.name: these are standardized so dashboards and alert rules can be written generically across any service.
The auto-instrumentation libraries follow these conventions. If you add manual instrumentation later (and you will, once you get hooked on traces), use the semantic convention constants from opentelemetry-semantic-conventions rather than making up attribute names. Your future self querying Tempo at 2 AM will appreciate it.
The One-Box Alternatives: SigNoz and Coroot
If the LGTM stack feels like assembling furniture from a bag of unmarked parts, two projects deserve your attention:
SigNoz: an open-source Datadog alternative with a single Docker Compose that includes its own ingestion pipeline, ClickHouse storage, and a polished UI. Traces, metrics, and logs in one interface with correlation built in. OTel-native from day one. If you want the experience of “open Datadog, see everything,” SigNoz is the fastest path there.
git clone https://github.com/SigNoz/signoz.gitcd signoz/deploy/docker compose up -dThat’s it. Point your apps at http://your-host:4317 and you’re sending telemetry.
Coroot: takes a different angle. It uses eBPF agents to auto-discover your services and their dependencies with zero instrumentation required. Generates service maps, latency analysis, and RED metrics (Rate, Errors, Duration) automatically. The free tier is genuinely useful; the paid tier adds more. For a home lab, Coroot is the least friction path to “what is my system actually doing.”
The honest comparison: Grafana LGTM gives you the most flexibility and the largest ecosystem. SigNoz gives you a polished out-of-box experience with less config overhead. Coroot gets you value before you’ve instrumented anything. They’re not mutually exclusive, run Coroot for auto-discovery while you’re building out OTel instrumentation for explicit traces.
A Few Gotchas Worth Knowing Now
Collector version pinning matters. The -contrib image moves fast. Pin to a specific version in your Compose file (the example above uses 0.130.0) rather than latest. Breaking changes in exporter configs happen more often than you’d like.
Tail-based sampling. The Collector’s batch processor is head-based by default: it makes sampling decisions at the start of a trace. For error-rate sampling (keep 100% of error traces, sample 10% of successful ones), you need the tailsampling processor and multiple Collector instances. Overkill for a home lab; relevant when your trace volume gets real.
Cardinality. This bites Mimir/Prometheus users. If you label metrics with high-cardinality values (user IDs, request URLs with parameters), your storage grows fast and queries slow down. Use metricstransform or filter processors in the Collector to drop high-cardinality attributes before they hit Mimir.
Storage retention. Tempo, Loki, and Mimir all default to storing data indefinitely until you configure retention. Set retention_period in each backend config early: 7 days for traces and logs, 30 days for metrics is a reasonable home lab default.
The Decision Tree
Start here based on your situation:
- “I want to understand what my services are doing with zero setup” → Coroot with eBPF agents. Five minutes to first service map.
- “I want a Datadog-like UI with everything in one place” → SigNoz. Single Compose, good defaults, OTel-native.
- “I want maximum flexibility and I’m already running Grafana” → Grafana LGTM (Loki + Grafana + Tempo + Mimir) + OTel Collector. More moving parts, more control.
- “I have multiple backends and want to decouple my apps from them” → OTel Collector regardless. It’s not either/or; Collector in front of SigNoz works great.
The LGTM stack is the right choice if you’re already invested in Grafana and want dashboards that talk to each other. SigNoz is right if you want to stop configuring things and start watching traces. Coroot is right if you want value before you’ve instrumented anything.
Whatever you pick: don’t pay Datadog prices for a home lab. The tools exist. The Compose files are above. Your server is right there.
Resources
- OpenTelemetry docs, the semantic conventions reference is worth bookmarking
- OTel Collector contrib releases, check here before pinning a version
- SigNoz self-hosted install
- Grafana LGTM stack, each component has minimal config examples in its GitHub repo
- Coroot, eBPF-powered, zero-instrumentation option